ORBACLES
Minneapolis, MN
2017
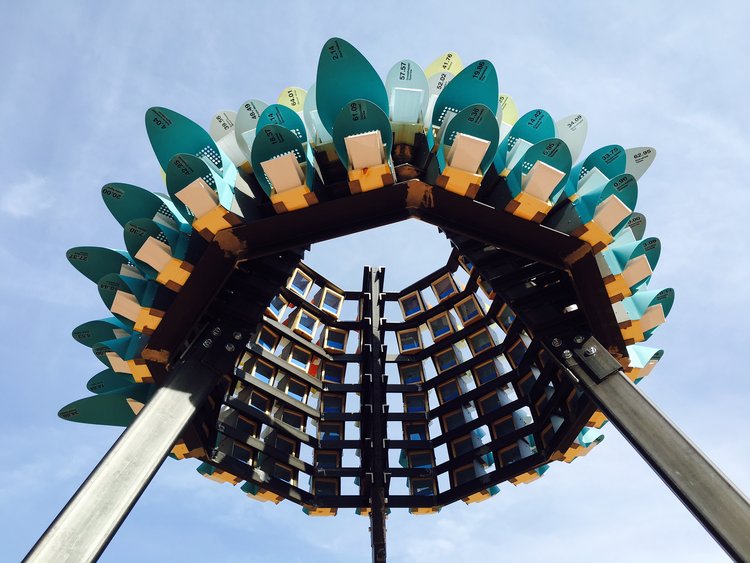
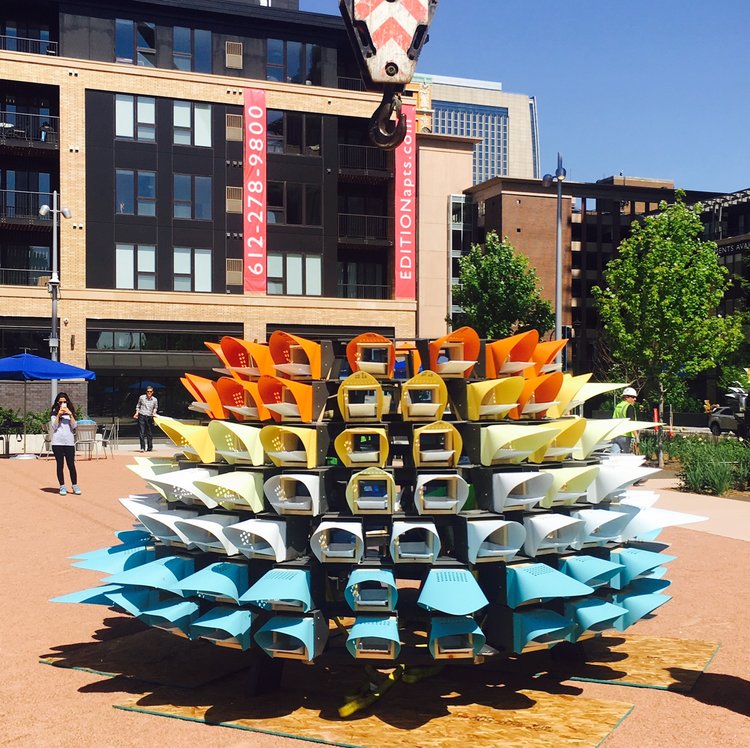
Orbacles is a triad of spherical environments that connect visitors to the reality of climate change through the story of birds in Minnesota and the language of our senses. As both a record and a speculation about the future through the end of the century, Orbacles communicates the current and anticipated shift of birds due to species loss and migration related to climate effects.
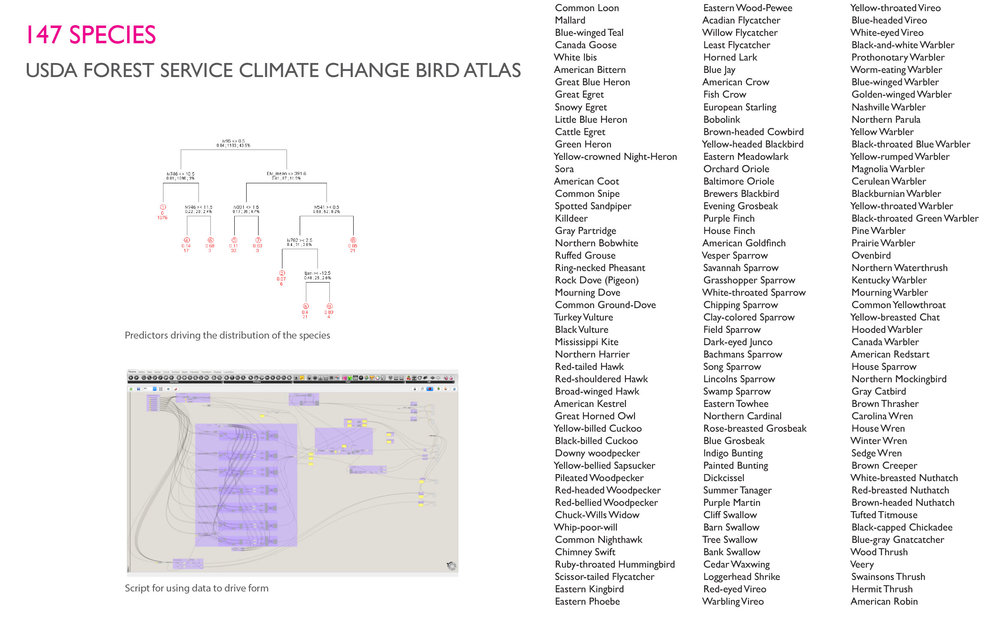
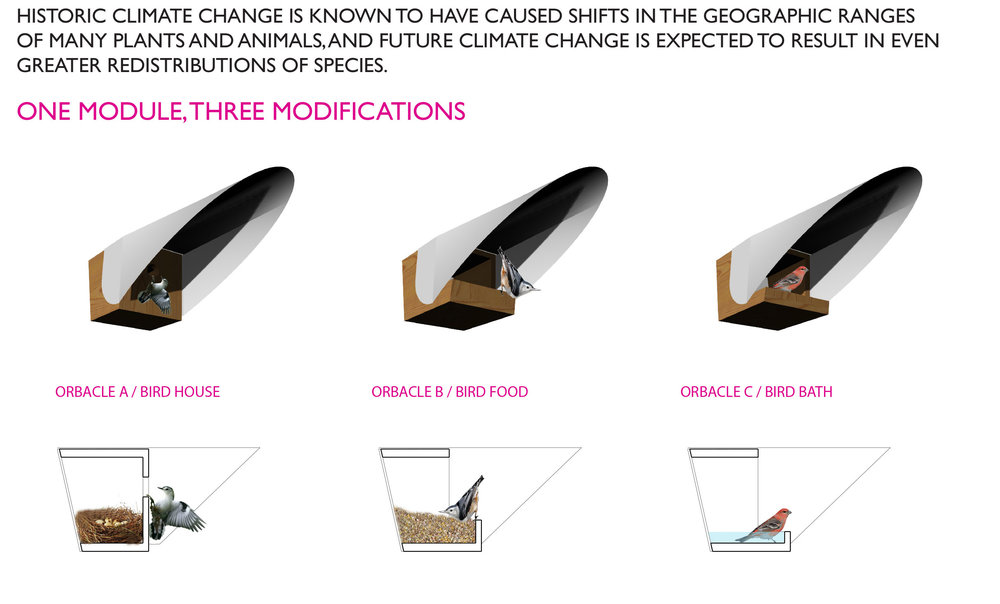
Each of the 147 bird species in the Climate Change Bird Atlas [1,2] is represented as a module – an individual birdhouse, feeder, or bath – with a hood that is sized to be proportional to the typical length and wingspan of the species [3]. The placement is consistent, so you will find one module for each species at a consistent location within each Orbacle.
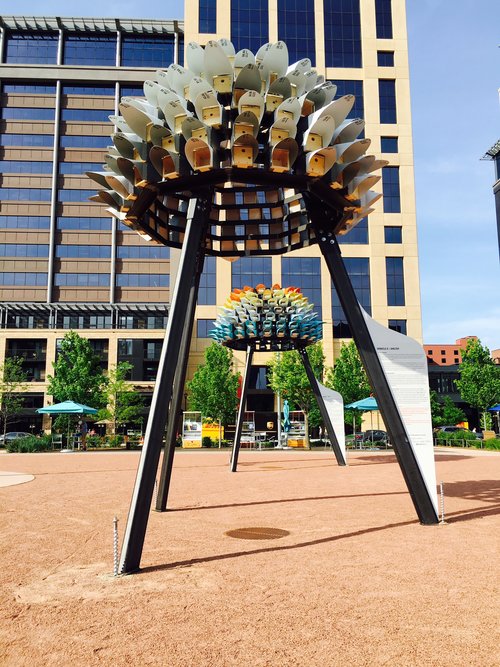
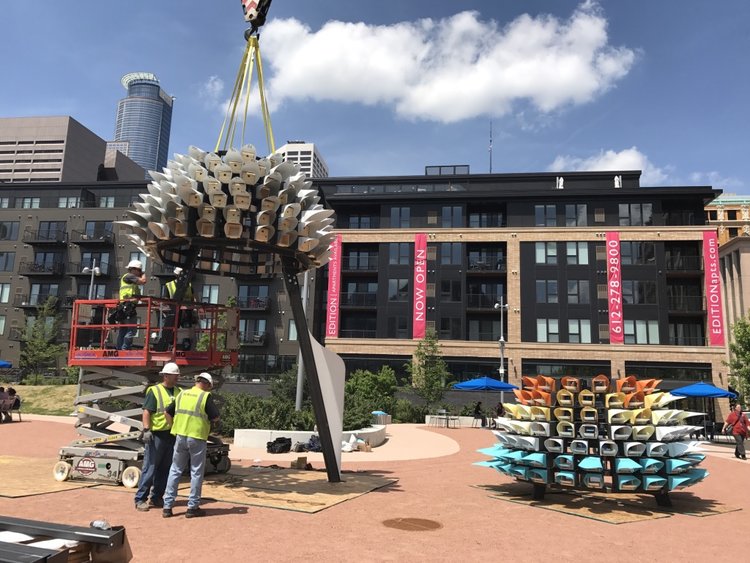
THE THREE ORBACLES: UNDERSTANDING FUTURE CHANGE
By 2100 the world will have changed in ways that are hard to imagine. To understand the possible impacts of these changes, scientists often compare multiple possible scenarios. The future scenarios represented in Orbacles come from the Special Report on Emissions Scenarios (SRES), developed by the Intergovernmental Panel on Climate Change (IPCC). The scenarios describe future worlds that range from very rapid economic growth and technological change to high levels of environmental protection, from low to high global populations, and from high to low greenhouse gas emissions.
Orbacle A | Shelter shows the current situation, using birdhouse modules. Orbacle B | Feeder shows a low emissions scenario that reflects “high level of conservation and reduction of CO2 emissions” [4], using bird feeder modules. Orbacle C | Bath shows a high emissions scenario, assuming that “the current [fossil fuel] emissions trends continue for the next several decades without modification” [4], using bird bath modules. To “read” the data and compare the different scenarios, look for changes in color compared to Orbacle A.
COLOR INDICATES CHANGE IN PREVALENCE
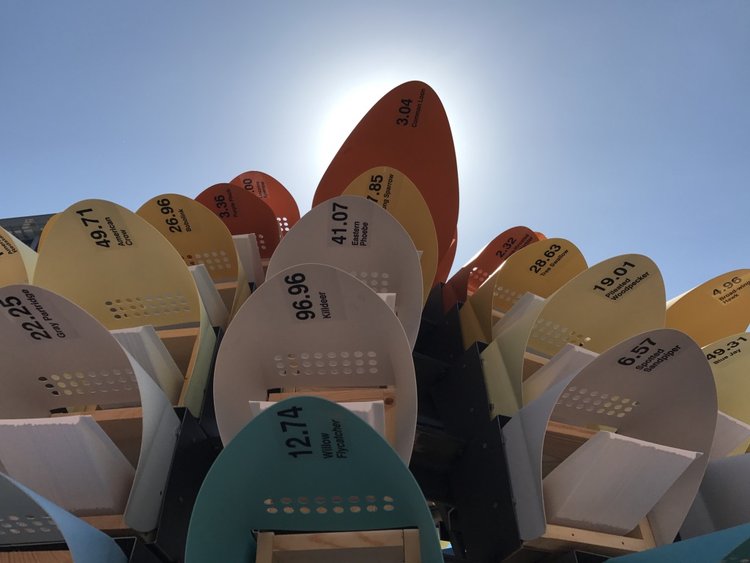
White represents a baseline – the current situation. If everything stayed the same in the future, then the two future Orbacles would be white, just like Orbacle A. If the color turns orange, this means the species is expected to become less prevalent in Minnesota. (Many species decrease in prevalence in the future, some will leave Minnesota entirely.) If the color turns blue, this means the species becomes more prevalent in the future. (Many non-native species are expected to come to Minnesota for the first time.)
The Prevalence Score that drives these color changes is a number between 0 and 100. It is derived from what scientists call an area-weighted bird incidence value [2], here calculated for the area of the state of Minnesota. It can be considered to be proportional to the actual population of each species, but it might be more accurately described as how likely you would be to come across this species on a (really long) walk throughout our state. In fact, the scientific models are built upon data from the North American Breeding Bird Survey, a roadside survey conducted annually since 1966 that involves stopping periodically along predefined routes to identify the species present at each location [4].
EXPLORE FOR YOURSELF
The interactive data graphic below uses the same data and spatial arrangement as the set of three Orbacles sculptures installed in Minneapolis. Hover your mouse over each module to see how the prevelance of the species in Minnesota is expected to change over time. Clicking on a module brings up a link to additional information about the species.
TAKING ACTION
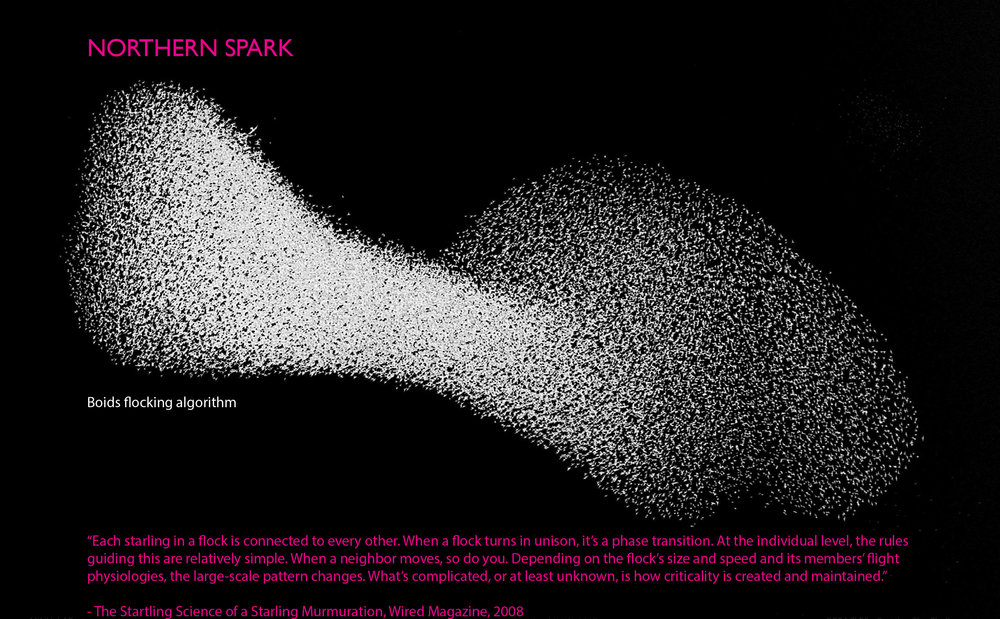
Our birds are a cultural marker. They are the voice of Minnesota. Historic climate change is known to have caused shifts in the geographic ranges of many plants and animals, and future climate change is expected to result in an even greater redistribution of species. Here are some things you can do to help our endangered birds:
CONSERVE ENERGY: conserve energy in your own home, buy energy-efficient appliances, walk, bike, carpool and take public transit.
EAT LOCAL: plant a garden, buy local, and compost waste.
EDUCATE YOURSELF: learn about climate change.
START CLIMATE CONVERSATIONS AND TAKE ACTION: Talk with others about climate risks and how you use energy and natural resources. The City’s Sustainability Office coordinates city-wide efforts to reduce greenhouse gas emissions. Local businesses and non-profits offer opportunities to reduce your footprint and save money at home and at work. To learn more about ideas or how to get involved with a local environmental organization to prevent climate change go to: www.ci.minneapolis.mn.us/sustainability/take-action/index.htm
DESIGN TEAM, PARTNERS, AND ACKNOWLEDGEMENTS
MINN_LAB is a design collective composed of architects, landscape architects, and computer scientists. We engage and facilitate cross disciplinary dialogue through the collective creation of site-based installations that foster awareness and critical inquiry into the nature of our cities, and imagine their possible futures.
The annual Creative City Challenge commission is made possible by the Arts, Culture and the Creative Economy program of the City of Minneapolis, hosted in collaboration with The Commons and Northern Lights.mn and the Northern Spark festival. Additional support was provided by the University of Minnesota Digital Design Center. This year's commission is based on the theme Climate Chaos, People Rising.
This project is made possible, in part, by the generous support of:
Arts, Culture and the Creative Economy, City of Minneapolis, https://www.minneapolismn.gov/coordinator/arts/acce
University of Minnesota Digital Design Center, https://ddc.design.umn.edu
MG McGrath, https://mgmcgrath.com
3M Design (signage materials sponsor), https://www.3m.com
Grain Millers, https://www.grainmillers.com
SCIENTIFIC DATA CREDITS AND REFERENCES
The data visualized come primarily from the Climate Change Bird Atlas (A Spatial Database of 147 Bird Species of the Eastern USA) [1,2]. Typical lengths and wingspans were retrieved from the Patuxent Bird Identification Infocenter [3].
- Matthews, S.N., L. R. Iverson, A.M. Prasad, A. M., and M.P. Peters. 2007-ongoing. A Climate Change Atlas for 147 Bird Species of the Eastern United States [database]. https://www.nrs.fs.fed.us/atlas/bird, Northern Research Station, USDA Forest Service, Delaware, Ohio.
- Matthews, S. N., Iverson, L. R., Prasad, A. M. and Peters, M. P. 2011. Changes in potential habitat of 147 North American breeding bird species in response to redistribution of trees and climate following predicted climate change. Ecography, 34: no. doi: 10.1111/j.1600-0587.2010.06803.x Published online: http://onlinelibrary.wiley.com/doi/10.1111/j.1600-0587.2010.06803.x/full
- Gough, G.A., Sauer, J.R., Iliff, M. Patuxent Bird Identification Infocenter. 1998. Version 97.1. Patuxent Wildlife Research Center, Laurel, MD. http://www.mbr-pwrc.usgs.gov/infocenter.html
- Sauer, J. R., D. K. Niven, J. E. Hines, D. J. Ziolkowski, Jr, K. L. Pardieck, J. E. Fallon, and W. A. Link. 2017. The North American Breeding Bird Survey, Results and Analysis 1966 - 2015. Version 2.07.2017 USGS Patuxent Wildlife Research Center, Laurel, MD. https://www.mbr-pwrc.usgs.gov/bbs/